For general reports info and settings check this page.
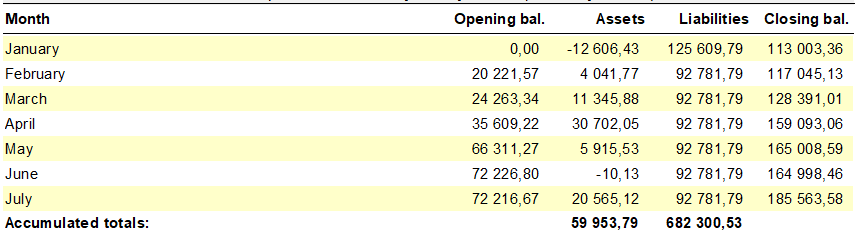
This is a Status report displayed as monthly figures, like this:
If you want it displayed as a stacked barchart like the screenshot below you will need to change the Display mode to Chart / Graph report. Below you will see that liabilities are light red, assets are light green and the accumulated assets-liabilities graph is navy blue.
Feature notice!
This report may also be displayed in graph / chart mode. See details here.