Manage graph settings
These controls are located in the lower left section of your Report window:
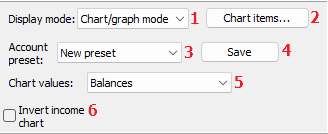
1 For graph reports, make sure to set the Display mode to Chart / Graph!
2 Click the Chart items button to open the list of available groups or account groups to be included in your graph(s). Note that the Result (monthly) report does not use these settings. For details on Chart items, see next section below.
3 Your saved selections may be loaded into the Chart items list by clicking this button.
4 Give your current selection a name and save it for later use by clicking this button.
5 Balances report only, selecting which 'column' to include:
Actual balances (as they appear in statements)
Opening balance ignored (as above but not counting opening balances)
Movements (Credit - Debit)
Debit column
Credit column
6 Only applicable for the Balances report:
Values become inverted (incomes become positive y values)
How to use the chart items window
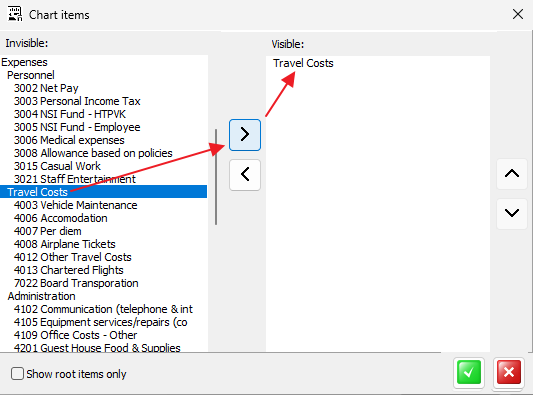
The left list shows all your available groups and accounts. You may select the desired items from the left list and move them to the right window by clicking the '>' button. To move them back again you click the '<' button. To avoid too messy graphs try to keep few items in the right (displayable) list. When finished, click the green OK button and then display the selected report. Enjoy!
Balance report view
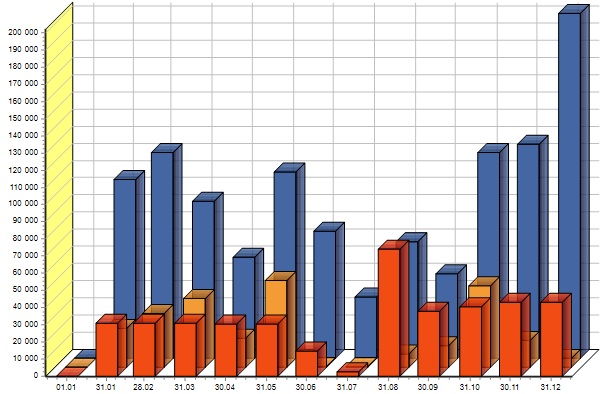
Here we have selected only three accounts in 'Chart items'. Please play with option 5 and 6 above to obtain the view you desire.
Balance values distribution from groups (piecharts)
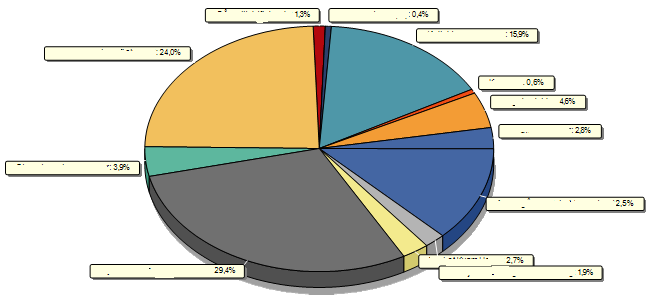
This report is only available from the Result and Status reports. Please select single groups like 'Incomes' or 'Expenditures' in 'Chart items' to see the value distribution of their subitems like above.
Periodic Result Report (Incomes, Expenses and Result)
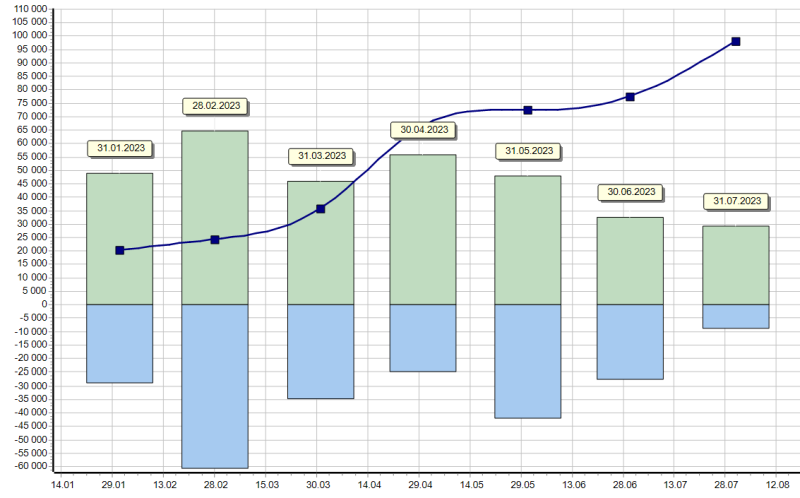
No parameters may be edited for this report. Dark blue curved line is the NET RESULT, blue bars display expenditures and green bars the incomes.